Tag: Data Projects

  • Global Top Trading Partner Dashboard: China vs. EU vs. U.S.

    Global Top Trading Partner Dashboard: China vs. EU vs. U.S.

    View the dynamic report here.

    Key takeaways
    • As of 2023, China is the largest trading partner with the rest of the world compared to the European Union and the United States
    • Total trade, sans trade with each other and intra-EU trade, increased for all three top trading powers
    • China’s trade with the rest of the world increased by more than 1,000% between 2002 and 2023 ($323 bn to $3.64 trillion), where as EU and U.S. trade increased by approx. 160% during the same period.
    • By number of countries with each as its top trading partner, China overtook the U.S. in 2009 and the EU in 2019. By total trade value, China overtook the U.S. in 2020 and competes with the EU between 2021-2023.

    Introduction

    Many articles and maps show how China overtook the United States as the world’s top trading partner in dollar terms in the last 20 years. Comparatively fewer comparisons take the European Union into account. As a bloc, the European Union account for 17% of global trade in 20241, valuing around 5 trillion dollars. With heightening global tensions and calls within the EU for greater strategic autonomy, EU could emerge as a significant player in the new era of international relations and trade. Therefore, it is important to account for the European Union when analyzing how the international trade system has changed over time.

    Methods

    Annual trade data for the EU2, United States, and China are extracted from Eurostat, U.S. Census Bureau, and the Havard Growth Lab respectively. Due to different data entry standards, time spans, and geographical extent, the data are first loaded in to Excel for initial cleaning before being further cleaned, transformed, and merged in Power Query. Trade between China, the EU, and the U.S. is excluded, as is trade between EU countries so as to focus only on how the three powers stack up against each other in the competition for the rest of the world’s trade. The result is a long table with each row representing one country or territory in a given year between 2002 and 2023 and three columns with values of the total trade volume (import + export) that country had with the European Union, United States, and China.

    GIF of a map of the top trading partner of countries around the world between 2002 and 2023

    Figure 1: GIF showing how the top global trade partners changed between 2002 and 2023

    Findings

    As expected, China is the world’s leading trade partner by both total dollar value and the number of countries which has it as the largest trade partner compared to the EU and the United States. In 2023, China led the pack with $3.64 trillion in total trade and was the largest trading partner of 77 countries. The EU followed in second with $3.6 trillion and 61 countries. The U.S. came in last at $3.53 trillion and 25 countries.

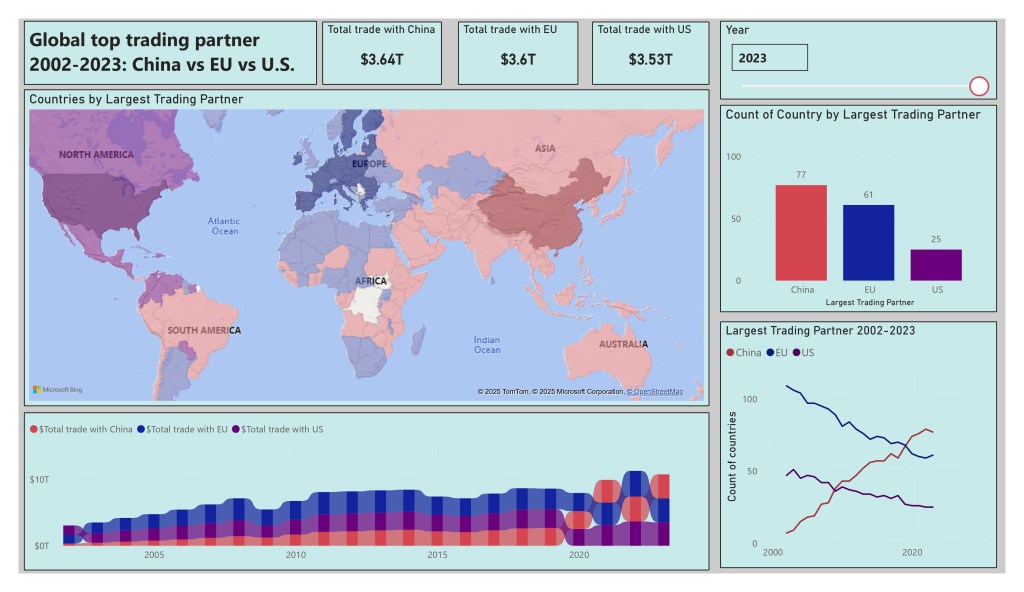
    Figure 2: Snapshot of the global trade situation in 2023

    Despite China’s seeming dominance in global trade, the competition remains fierce. A few points to keep in mind:

    • Although China overtook the U.S. and the EU by number of countries with which it is the largest trade partner in 2009 and 2019 respectively, it has only managed to overtake the U.S. by total trade value in 2020 and is still competing for the top spot with the EU as of 2023.
    • The total trade value of the three trading powers are very close, with only 3% of difference between China at number one and the U.S. at number three.
    • The U.S. and the EU, when combined, still outweighs China in international trade. This highlights the importance of the transatlantic alliance in checking China.

    Regional spotlights

    Unsurprisingly, each of the three top trading powers are strongest in their respective neighborhoods.

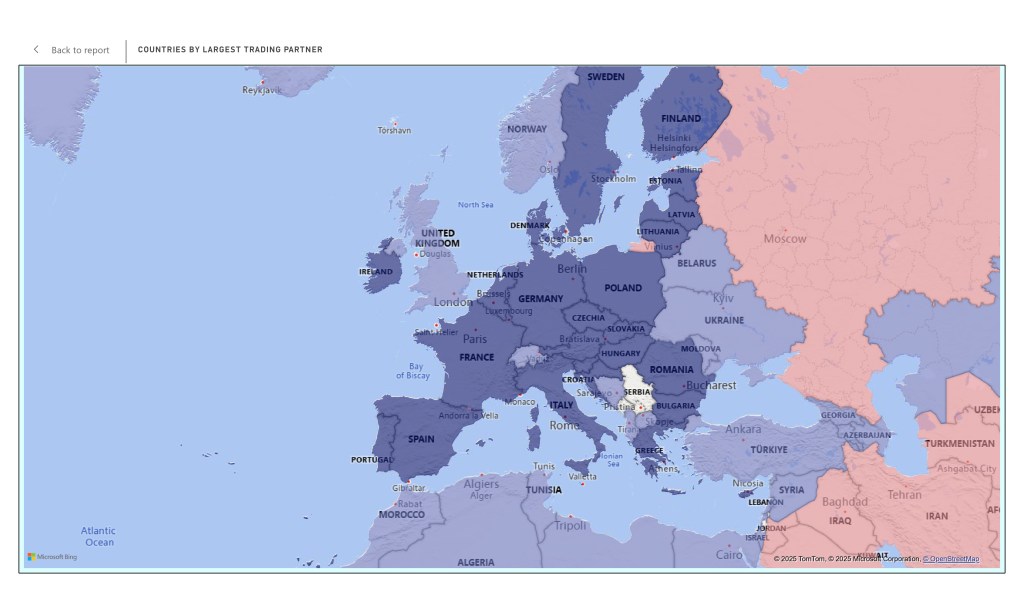
    Figure 3: From left to right: Trade in Asia-Pacific, Europe and the Mediterranean, and North and Central America are dominated by China, the EU, and the U.S. respectively.

    However, some areas are still contested between China, the EU, and the U.S. Africa is split between the EU–which is strongest in the northern and southern edges of the continent–and China, which is strongest in East Africa and has gradually grown in influence in Central and West Africa. Meanwhile, South America is contested by all three, with countries on the northern end of the continent (Venezuela, Colombia, Ecuador) trading more with the U.S. and the major South American economies of Brazil and Chile trading the most with China. The EU has managed to retain its top trading position in Argentina and Guyana.

    Figure 4: Africa and South America by top trading partner, 2023

    Conclusion

    Despite the historical dominance of the EU and U.S. in global trade, China has rapidly caught up to them by 2023. China is now the world’s leading trade partner, with the highest trade value and the most countries having it as the largest trade partner. The EU remains a significant player across the globe, especially in Africa, the Middle East, and rest of Europe. The U.S., though dominating less countries in terms of trade than the others, remains very close to China and the EU in total trade value. Overall, the competition for global trade is far from settled and will likely heat up as tensions and uncertainty rise in the coming years.

    Notes

    1This figure is derived by taking the total global trade volume of 2024–33 trillion dollars, and subtracting it by the volume of intra-EU trade at 4 trillion dollars, as we are treating the EU as a single trading bloc. The subsequent figure of 29 trillion dollars is then used to calculate the relative proportion of extra-EU trade, which is around 5 trillion dollars.

    2Eurostat retroactively includes all current EU member states (the “EU 27”) and excludes the United Kingdom from its historical trade dataset. As such, for consistency, this project will not reflect the changing EU membership (13 accessions and 1 departure) in the two decades between 2002 and 2023.

    References

  • A center of gravity analysis of major world religions

    In cartography, a center of gravity represents the midpoint between different weighted locations. It is a commercially useful tool to select locations that minimizes distance to locations and clients. For example, you can use this to select warehouse locations to maximize delivery efficiency–with each location weighted by the number of orders to be fulfilled.

    In this case, I wanted to see where the demographic “centers of gravity” of major world religions. For each country and territory, I generated a geographic centroid, added data for the number of adherents of four selected religions–Christianity, Islam, Hinduism, and Buddhism–and generated a center of gravity for each religion where the number of adherents in each country and territory served as weight.

    It’s a simple map: the source for the number of adherents is Wikipedia. The countries and territories shapefile I downloaded from opendatasoft. I did have to make some adjustments when generating the geographic centroids as some countries (cough* the United States) have far-flung, sparsely populated exclaves that mess with the location of the centroids. Otherwise, it’s a lot of joins by attribute and adjusting labels and symbology. Anyway, enjoy.

    For the most part, the centers of gravity turned out to be roughly where I expected them. Hinduism, despite significant number of adherents in such distant places like Canada, remains a decidedly Indian religion. Buddhism, on the other hand, pulled by the hundreds of millions of believers in China as well as huge numbers in Japan and Korea, has moved out of the Indian subcontinent deep into China (roughly where I originated, Sichuan).

    Islam is a bit more surprising. I had expected its center to shift further southeast on account of the large number of muslims in South and Southeast Asia–the three countries with the most muslims are Indonesia, Pakistan, and India–and yet, it clings stubbornly on the edge of the Arabian Peninsula, where it originated 1400 years ago.

    Christianity was always going to be the wildcard. If you asked me to guess where the centers of gravity of the three other religions were before I made this map, I would probably have been at least somewhere in the ballpark. With Christianity, I would have had no idea. From its old stronghold in Europe it had accompanied every colonial boat to the North and South Americas, to South and East Asia, to Sub-Saharan Africa, and to Oceania down to the tiniest inhabited island. Keeping in mind that I calculated the centers of gravity using mean geographic coordinates, it probably isn’t coincidental that its current location in Mali, not too far from Timbuktu, is remarkably close to the “null island”: the exact intersect point between the Eastern, Western, Northern, and Southern Hemispheres.

    The distance between Christianity’s center of gravity and the 0, 0 coordinate point (null island) is about 1217 miles

    In the future, I may make a series exploring how these centers of gravity changed over the centuries or how they would look like using a spatial median approach instead of just calculating mean coordinates (which ignores the spherical surface of the earth).

    Happy to hear any feedbacks or questions!

  • Which part of Los Angeles has the most Starbucks: A Density Analysis

    Which part of Los Angeles has the most Starbucks: A Density Analysis

    I lived in Westwood Village, Los Angeles, for over six years. It’s a charming college town amid a bustling city, distinguished from its surroundings by atypical walkability and an incredible concentration of boba shops and cafés.

    Map 1: Westwood Village. The idyllic name contrasts with the office towers and the research university that surround and sustain it

    Among other attractions, the village boasts not one or two, but four Starbucks within a 10-minute walk from each other–two in a multi-story Target/Ralphs’s complex, one next to the village theaters, and another one a couple blocks down, opposite the Hammer Museum. I’ve been to all four, though not on the same day–that would wreck both my mind and wallet. Still, I wanted to know if Westwood is uniquely blessed in its abundance of Starbucks and, if not, where I can find the most Starbucks in Los Angeles.

    So, I decided to put my GIS skills to good use. I found a spreadsheet of every Starbucks location around the world along with street addresses. I cleaned them up and manually geocoded the locations that the program couldn’t automatically identify. Unfortunately, the best data I could find is from 2017, so more Starbucks could have opened (or closed) since then. Hopefully, the conclusions remain the same.

    Map 2: Starbucks Density Heatmap.

    A kernel density analysis results in a simple heatmap showing the distribution of Starbucks in LA County. At first glance, we see a few obvious dark spots on the map–Pasadena, Long Beach, LAX, Santa Monica, the Wilshire Corridor leading up to Hollywood, and, of course, Downtown Los Angeles. It’s clear from the heatmap that Downtown has the highest concentration of Starbucks, but I wanted to know more. I can walk to four Starbucks in under 10 minutes from the middle of Westwood Village; just how many Starbucks can I walk to in the same amount of time in DTLA?

    Map 3: Los Angeles County Walkable Starbucks Map

    To answer that, we need more than a heatmap. Wikipedia says that the average human walking speed is 1.42 meters per second. Multiplied by 600, a 10-minute walk would take you 852 meters. Here, I’ve rounded it to 850 meters or about 2790 feet. To count how many Starbucks we could walk to within 10 minutes, I created an 850m wide buffer around each Starbucks. The rationale is simple: if two buffers intersect at one point, it means that, from that point, you can walk to two Starbucks. By counting the number of overlapping buffers at each intersection, I arrived at the number of Starbucks within a 10-minute walking distance for every point in Los Angeles County.

    Note that the buffers are drawn as a circle with each Starbucks at the center and a radius of 850m. This does not take into account real-world factors that impact how far one can walk in 10 minutes, like road networks or pedestrian accessibility–all of which would likely slow down the hypothetical pedestrian. However, I would consider any Starbucks within a 15-minute or 20-minute walk to still be worth walking to (your mileage may vary), so an 850m straight-line distance, factoring in real-life conditions, should still work as a rough gauge of how many Starbucks are within my subjective walking distance.

    Map 4: Four Areas with the Highest Concentration of Starbucks in LA County

    I selected the four areas in the county where the concentration of Starbucks locations is highest. As the heatmap had shown, DTLA is the densest, with most of the Financial District between the 110 and 101 freeways smothered in Starbucks. There are 4 small polygons with 15 Starbucks within walking distance in this area, making them ideal destinations for those with a particular craving for iced lattes. Honestly, I’m a little surprised. In my experience, there didn’t seem to be that many Starbucks in Downtown. Whether it is because some locations are hidden away in office towers and shopping malls or because some locations have closed since this data was compiled in 2017, I can’t say.

    Second place is LAX, where the multitude of airport terminals helps boost the concentration of Starbucks locations. Just off the eastern end of the north runway, one could hypothetically walk to any of the 10 Starbucks nearby. In actuality, it’s hard to see how anyone could go to even half of them, given that many are in terminals behind the TSA, to say nothing of the abysmal pedestrian infrastructure there.

    Downtown Santa Monica has a more genuine concentration of Starbucks, with the densest spots having access to 8 locations within walking distance. It’s not surprising that Santa Monica and Hollywood–with 7 walkable Starbucks on Sunset Boulevard just southeast of the Chinese Theater–came in third and fourth place. Both places have relatively dense commercial cores with a lot of foot traffic.

    Map 5: Downtown LA in Focus

    To finish it off, I wanted to focus on the four tiny spots in Downtown Los Angeles where the concentration of Starbucks–15 within walking distance–is the highest in the county. As the map above shows, apart from one tiny spot across from the Grand Central Market, the other three locations are all located in the few blocks bounded by 7th and 8th streets horizontally and Olive and Figueroa streets vertically. Given the abundance of shopping centers in and near the area (the Bloc, Figat7th) and its centrality in the Downtown area as a whole, this is within expectations. Still, I have yet to verify the situation on the ground. Someday, I’ll go and count up all the Starbucks myself–I’ll just have to try getting too hyped up on caffeine.


    References:

    Tools used:

    Detailed methodology can be found here